If you are on an M4 Pro, skip this generation. Across every test we ran, the M5 Pro was between 6% and 9% faster — a gap you will not feel. If you are on an M1 Pro, the answer depends entirely on what you do with the machine: we measured anywhere from 1.40x to 2.38x, and the difference between those two numbers is the whole decision.
We tested three MacBook Pros we own, on the same day, with the same workloads.
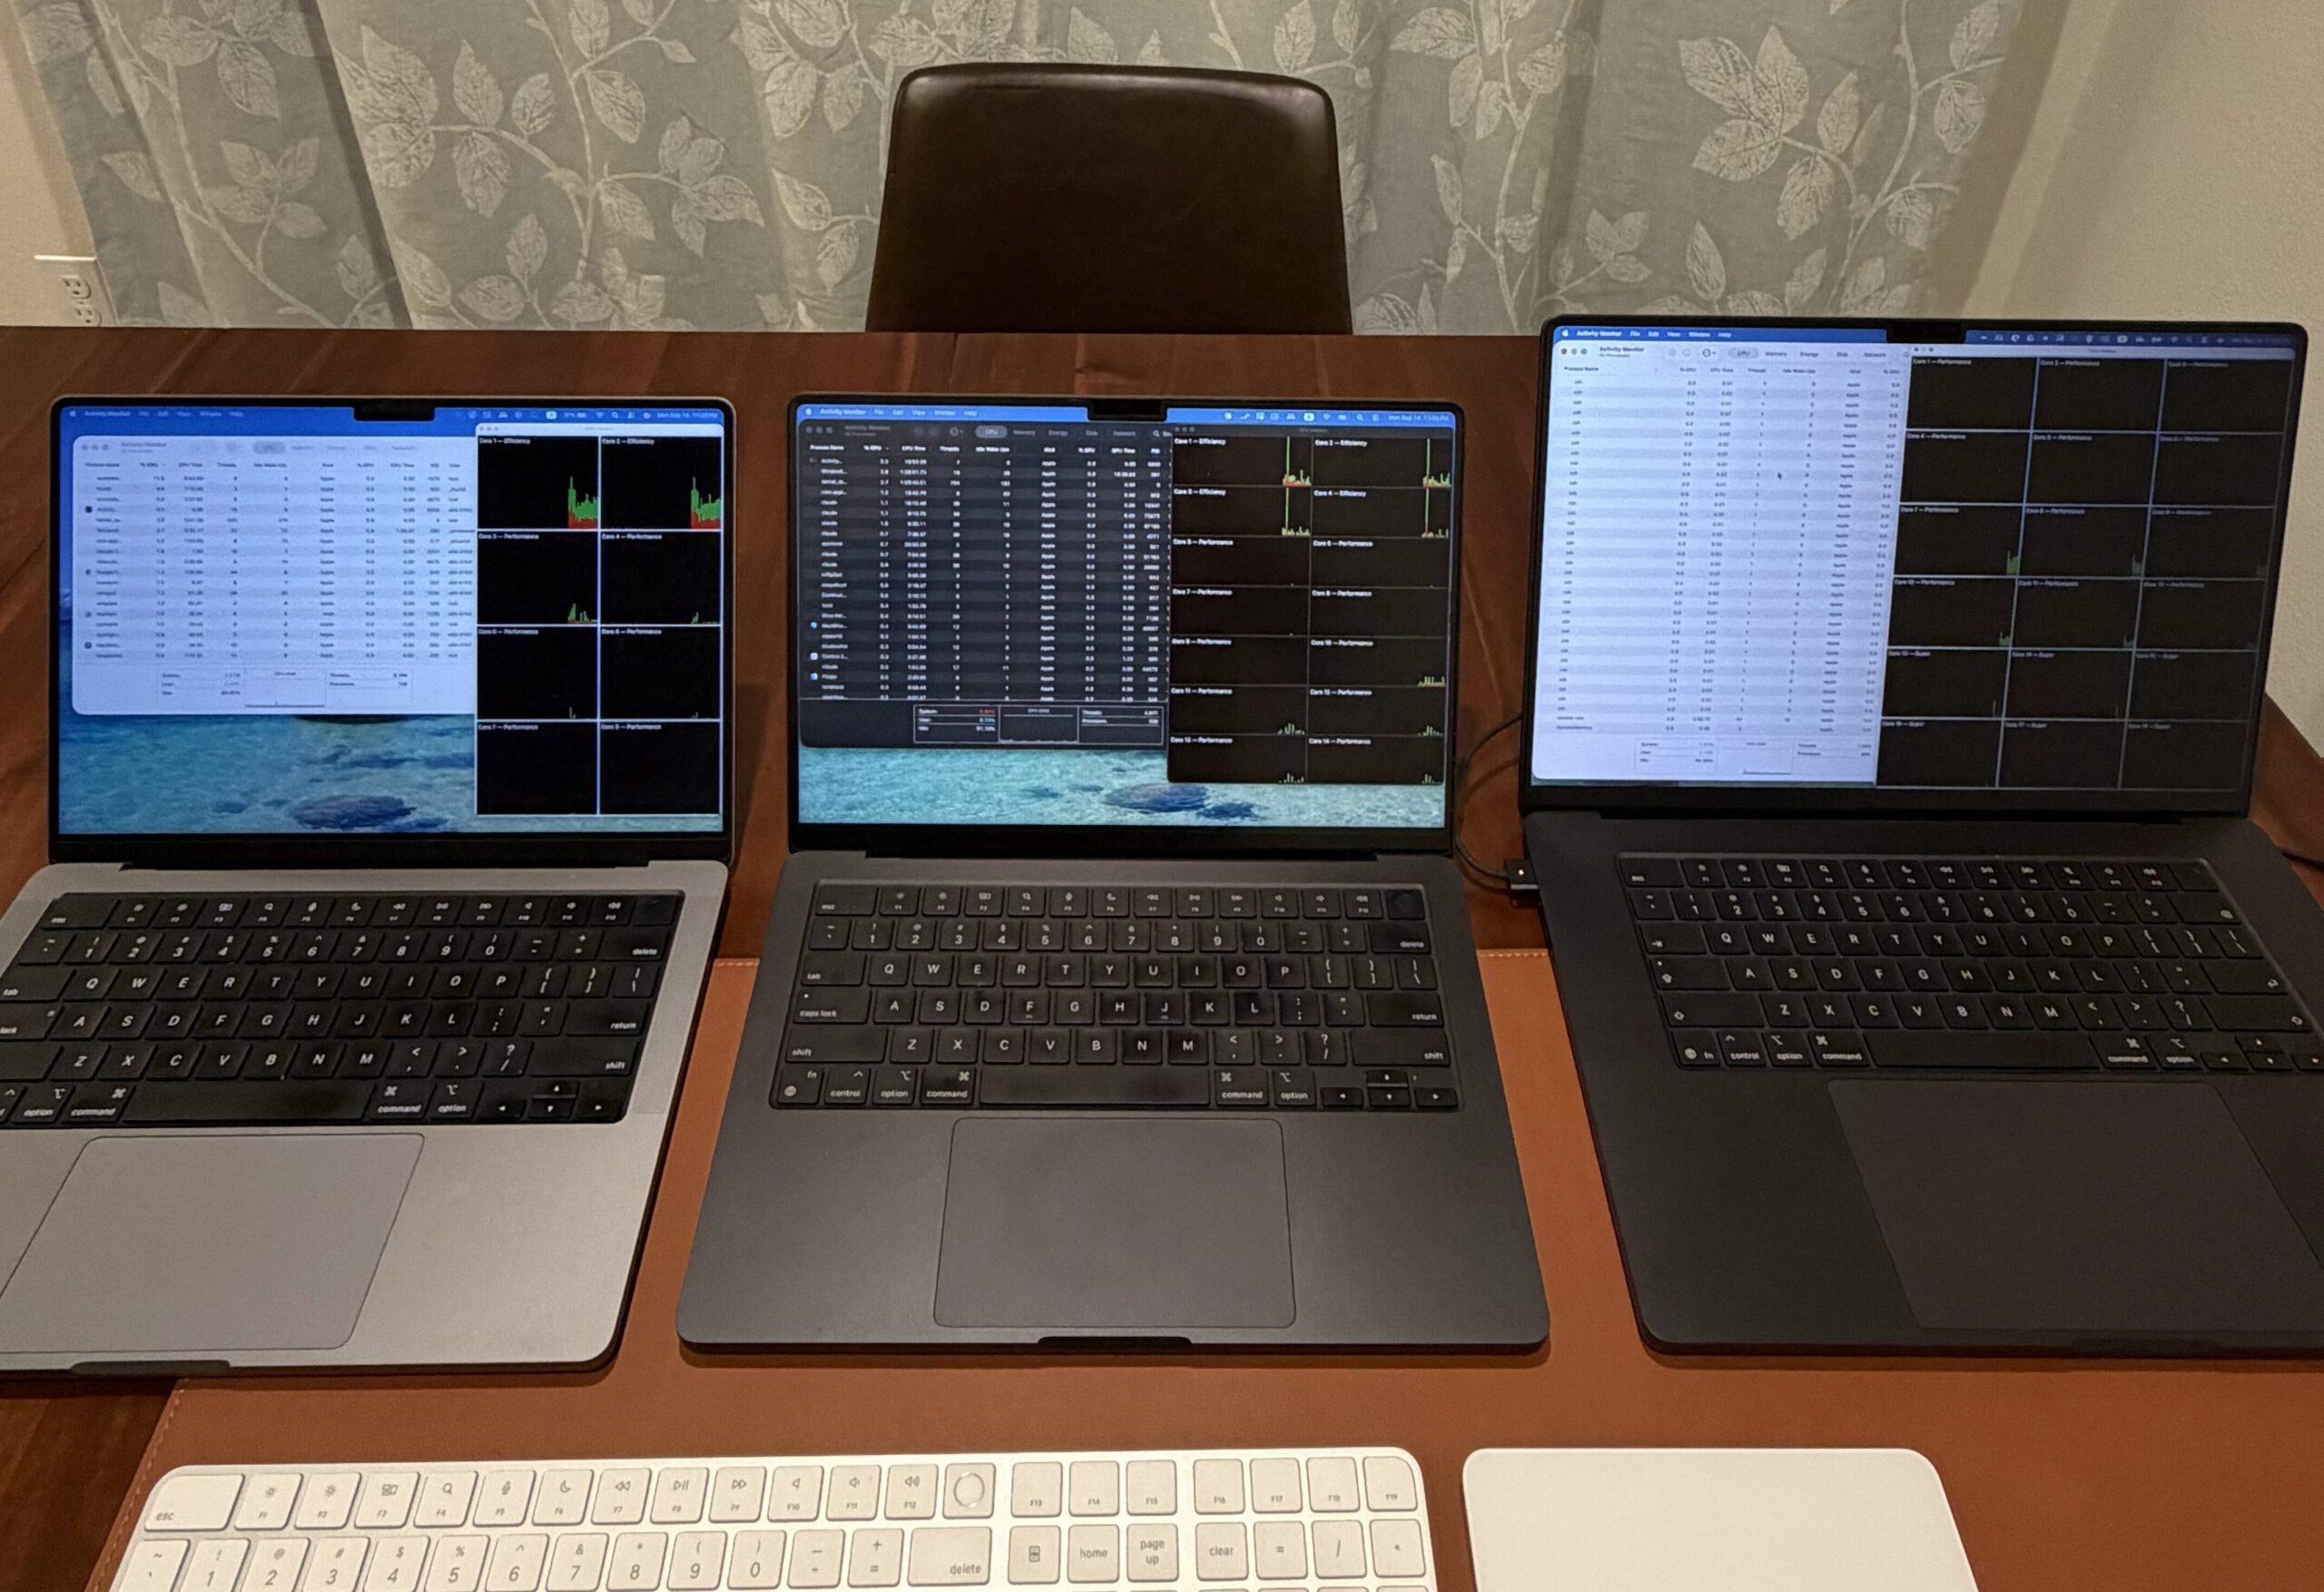
The test bench: 14-inch M1 Pro, 14-inch M4 Pro, 16-inch M5 Pro. All three bought, not loaned.
The numbers
| M5 Pro 16″ | M4 Pro 14″ | M1 Pro 14″ | |
|---|---|---|---|
| Single-core compression | 1.75s | 1.90s | 3.05s |
| All-core compression | 0.39s | 0.42s | 0.85s |
| CPU video encode (x264) | 3.60s | not tested | 8.58s |
| Hardware video encode | 3.34s | not tested | 4.68s |
| Browser responsiveness | 55.0 | 51.2 | 35.6 |
| Work done in 8 minutes | 1,215 | 1,148 | 562 |
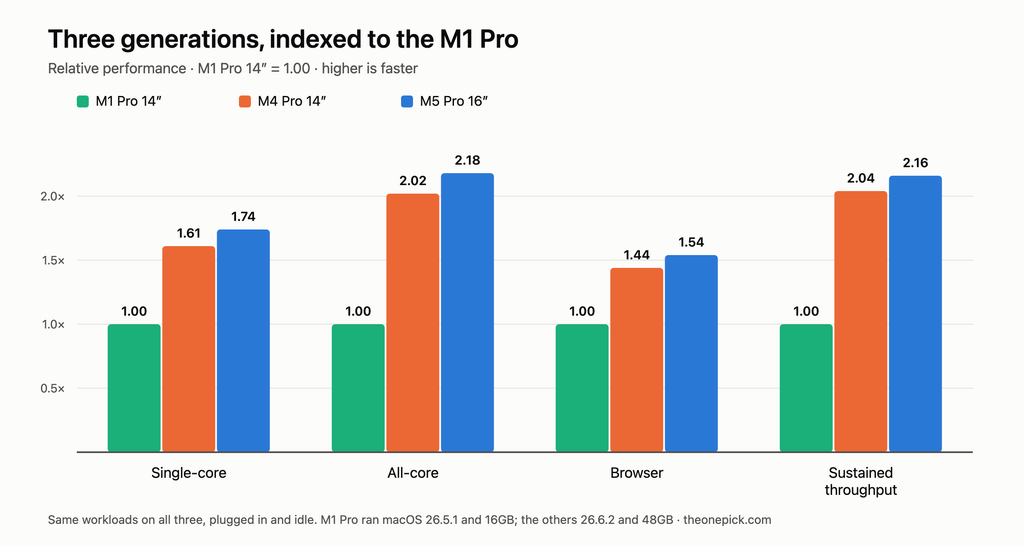
Times are seconds, lower is better. Browser responsiveness is a Speedometer 3.1 score, higher is better. The last row counts how many identical compression passes each machine finished during a continuous eight-minute load.
One generation is not a reason to buy
M5 Pro against M4 Pro, every measurement we have:
| Test | Gap |
|---|---|
| Single-core | 1.09x |
| All-core | 1.08x |
| Sustained throughput | 1.06x |
| Browser | 1.07x |
Six to nine percent. Our run-to-run variation on these machines was 1.5% to 7.8%, so the gap is real and sits above our noise — but a 9% difference on a task that takes ten seconds saves you under a second. Nobody notices that. If you own an M4 Pro, there is no performance argument for replacing it, and we are not going to invent one.
Four generations is a different question, and it has no single answer
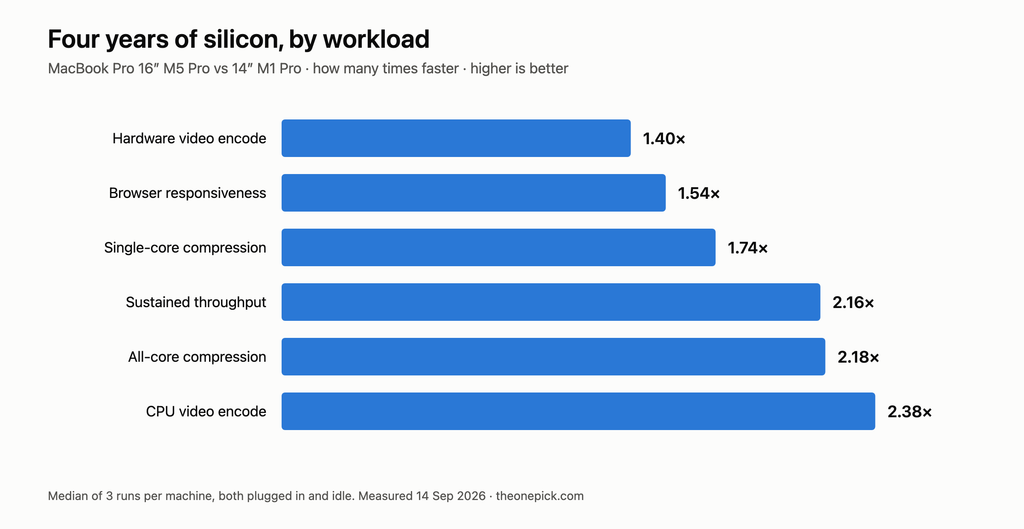
M5 Pro against M1 Pro, the same measurements:
| Test | Gap |
|---|---|
| Hardware video encode | 1.40x |
| Browser responsiveness | 1.54x |
| Single-core | 1.74x |
| Sustained throughput | 2.16x |
| All-core | 2.18x |
| CPU video encode | 2.38x |
The spread between the smallest and largest gap is 70 percentage points. This is the part most comparisons flatten into one number, and flattening it gives the wrong answer to half the people reading.
If your heavy work runs on the hardware video encoder — exporting footage in an editor that uses it — four years of silicon bought you 1.40x. That is the weakest result in our entire test set, and it is worth knowing before you spend money.
If your heavy work is CPU-bound — software encoding, compilation, anything that saturates cores — the same four years bought you 2.38x, and the machine finished 2.16x as much work during a sustained eight-minute load. That is a different machine in daily use.
Browser work sits in between at 1.54x, which is where most people actually live.
The core counts do not line up the way you would expect
Open Activity Monitor on each machine and the core labels tell their own story:
| Cores | Breakdown | |
|---|---|---|
| M1 Pro 14″ | 8 | 6 Performance + 2 Efficiency |
| M4 Pro 14″ | 14 | 10 Performance + 4 Efficiency |
| M5 Pro 16″ | 18 | 12 Performance + 6 Super |
The M5 Pro has no cores labelled Efficiency. What macOS used to call efficiency cores are now labelled Performance, and a tier above them is labelled Super — a name Apple’s own specification pages do not use. You can read it yourself with sysctl hw.perflevel0.name.
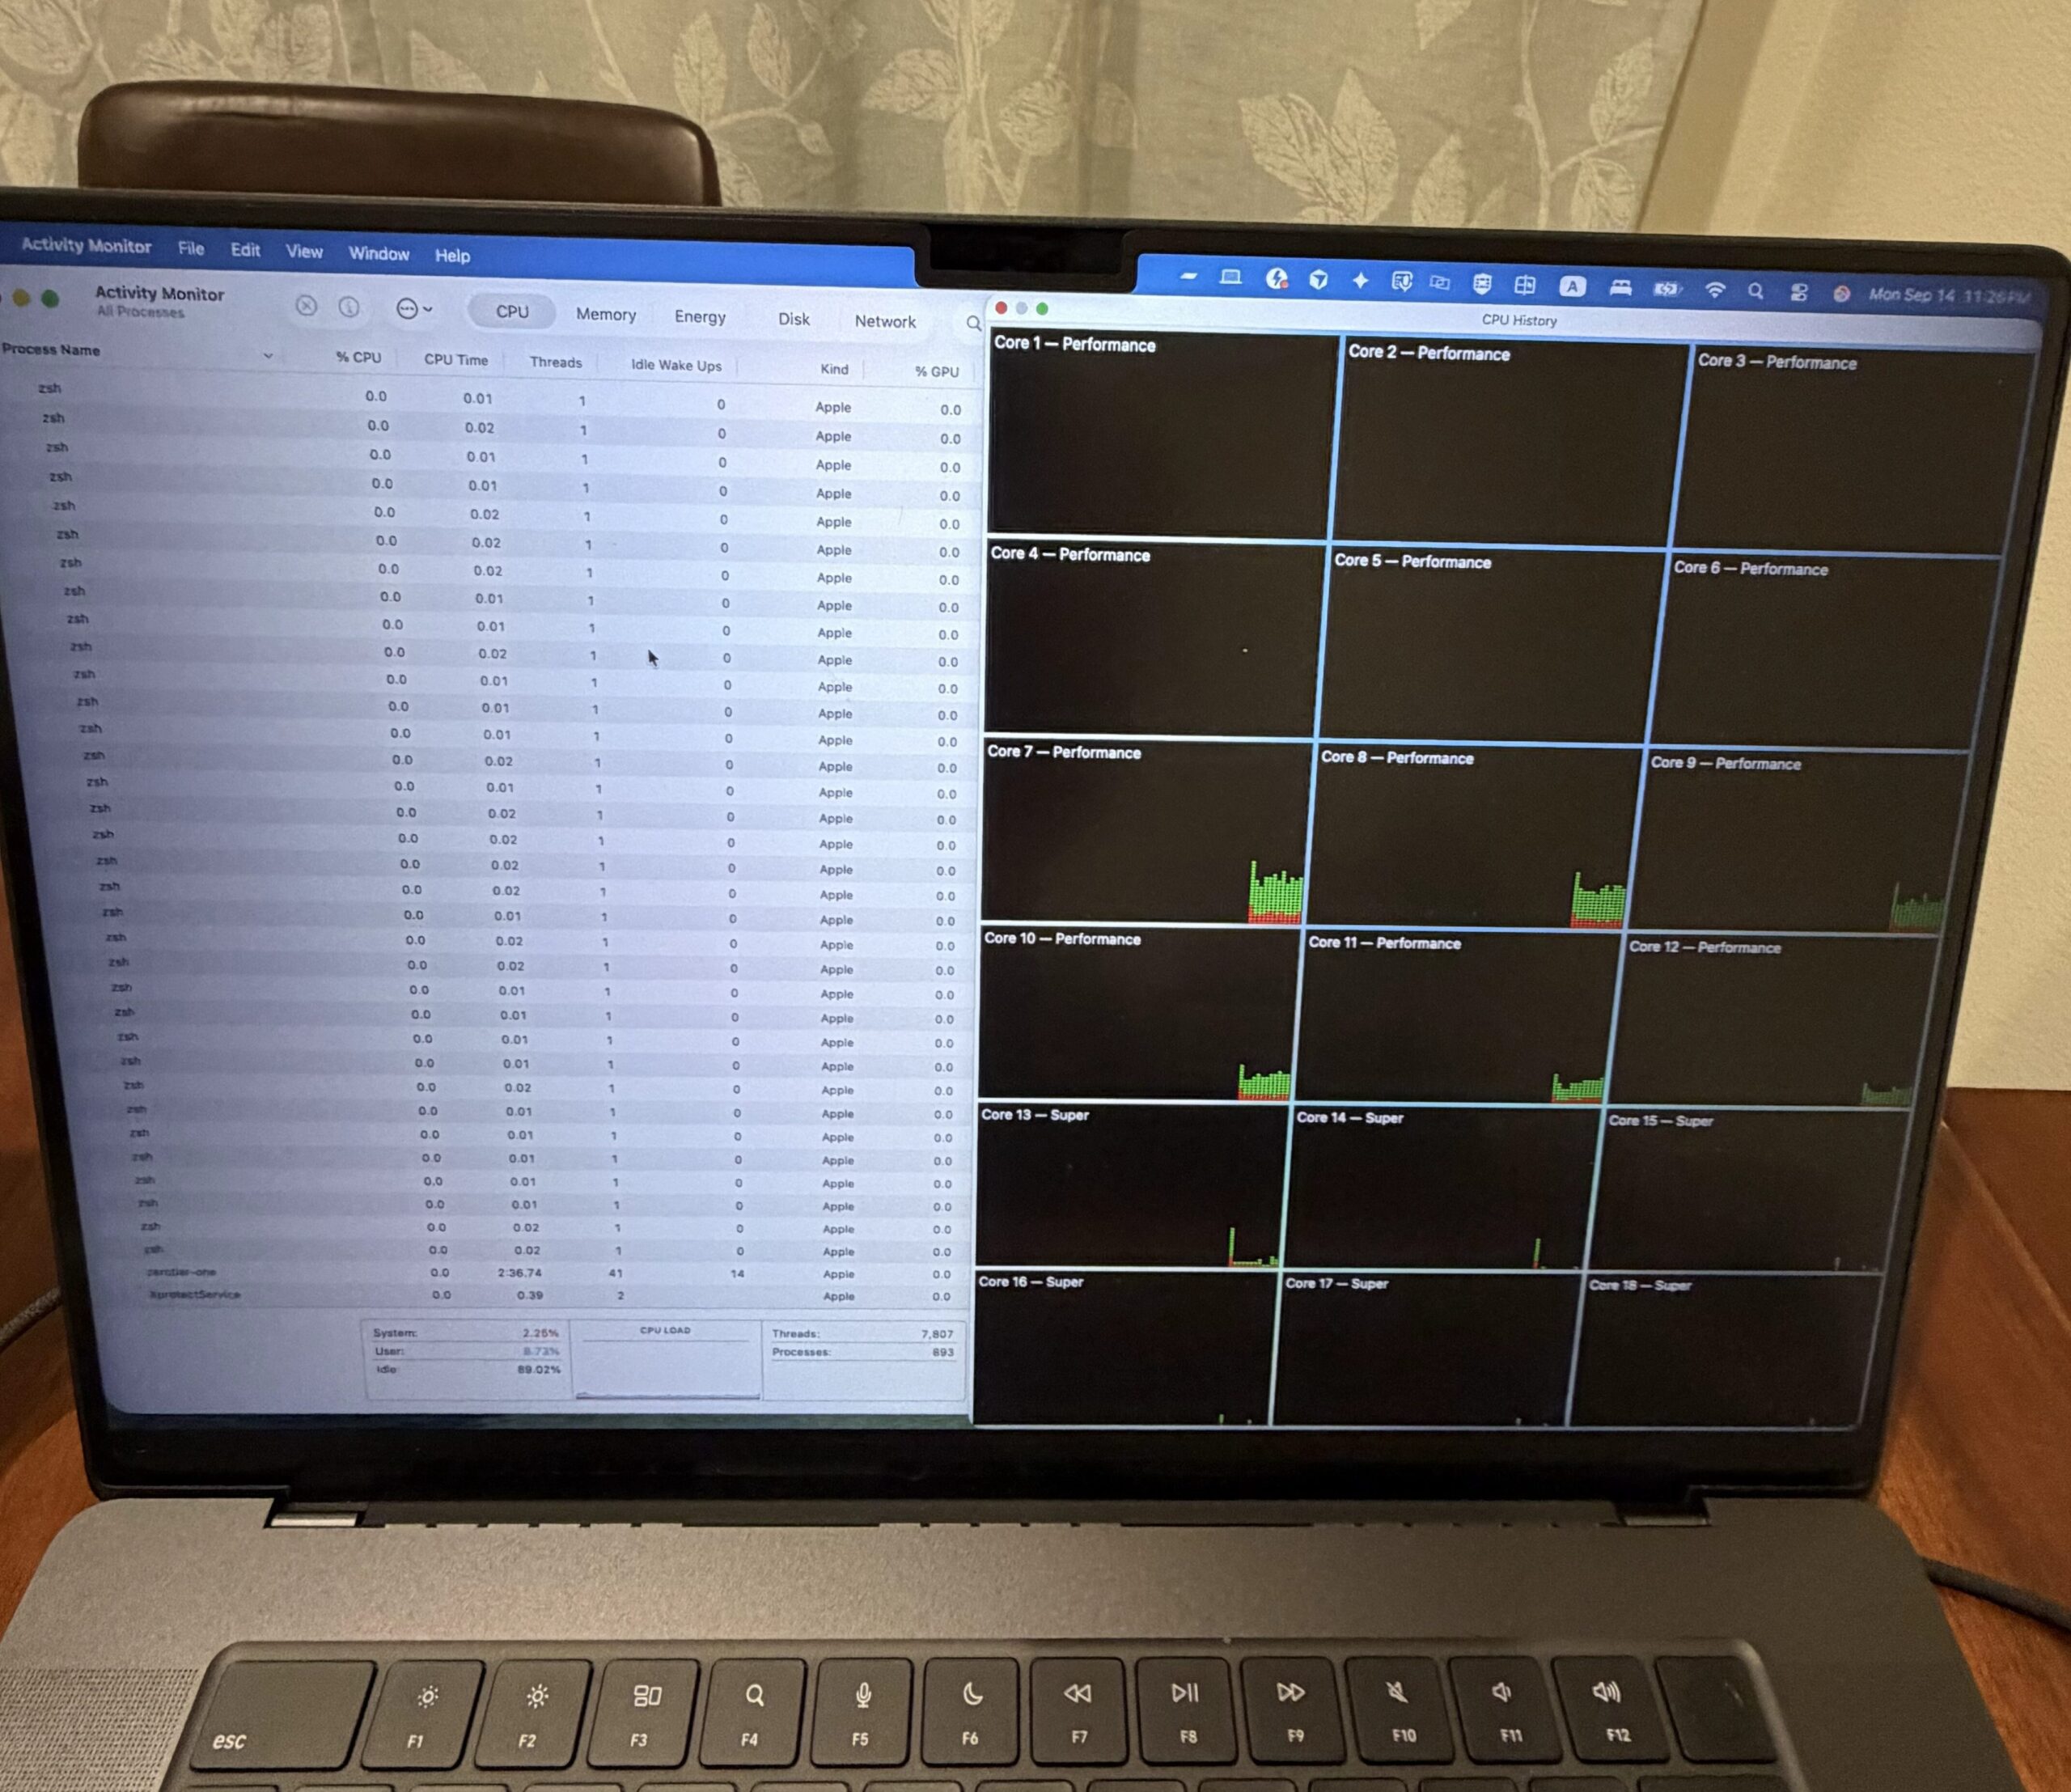
M5 Pro: Cores 1-12 Performance, Cores 13-18 Super.
We are reporting the labels and the counts, which are verifiable. We have not yet measured what a Super core does differently, and until we pin work to specific cores we are not going to guess.
Who should move
Upgrade from M1 Pro if: your work is CPU-bound, or you regularly run loads long enough that throughput matters more than burst speed. The sustained numbers are where the M1 Pro falls furthest behind — 562 passes against 1,215.
Stay on M1 Pro if: your heavy lifting goes through the hardware video encoder, or your work is mostly browser and text. A 1.40x gain on the work you actually do is not worth a four-figure purchase, and the M1 Pro held its performance under load as well as the newer machines did.
Stay on M4 Pro: in every case we measured.
Check your own machine
Every figure here came from tools already on your Mac. The core tiers:
sysctl -a | grep perflevel | grep name
And a compression run you can compare against our table, single-threaded then across all cores:
zstd -12 -f -q -T1 -o /tmp/out.zst /tmp/bigfile.bin
zstd -12 -f -q -T0 -o /tmp/out.zst /tmp/bigfile.bin
Run each three times and take the median. Close your browser first — leaving ours open cost us 20% and produced a result that was simply wrong.
What we could not test
Our three machines are not a controlled experiment, and we are not going to present them as one. Four differences sit inside these numbers:
- The M1 Pro has 16GB of memory. The other two have 48GB. None of our tests pushed any machine into swap, so we do not believe memory drove these results, but we cannot rule it out and we did not measure memory pressure.
- The M1 Pro was running macOS 26.5.1 while the other two ran 26.6.2. Part of the gap could be the operating system rather than the chip. We will be able to separate these once all three are on the same version.
- The M5 Pro is a 16-inch machine; the other two are 14-inch. The 16-inch chassis has more cooling. This matters most for the sustained-load row, where the larger machine has an advantage that has nothing to do with its processor.
- The M4 Pro had no video encoding tools installed, so two rows of our table are blank for it rather than estimated.
We would rather publish a table with holes in it than fill the holes with guesses.
How we tested
Every machine ran the same three workloads, generated on the machine itself so no files moved between them: a 512MB text file compressed with zstd 1.5.7 at level 12, single-threaded and then across all cores; a 30-second 1080p clip encoded twice, once in software and once through the hardware encoder; and Speedometer 3.1 in Safari. Each result is the median of three runs, and we recorded the spread.
The sustained test ran the all-core compression on repeat for eight minutes and counted completed passes. We also timed the first and last pass to check for thermal throttling. None of the three machines throttled — the M5 Pro finished 0.5% faster at the end than the start, the M4 Pro was 0.5% slower, and the M1 Pro 2.1% slower. All three are within what we would call flat.
Every machine was plugged in, idle, with applications closed. That last condition turned out to matter more than we expected: our first attempt measured the M5 Pro while it was in normal use, and it came out slower than the M4 Pro — a result that is obviously wrong and that cost us a full re-test. Background applications shifted the single-core figure by 20%.
Machines: MacBook Pro 16-inch M5 Pro (48GB/1TB, battery health 100%, 5 cycles), MacBook Pro 14-inch M4 Pro (48GB/1TB, 99%, 72 cycles), MacBook Pro 14-inch M1 Pro (16GB/512GB, 86%, 264 cycles). Tested September 14, 2026.
Related measurements from the same machines: the six cores Apple never named, eight minutes flat out, and what 264 cycles did to a battery.