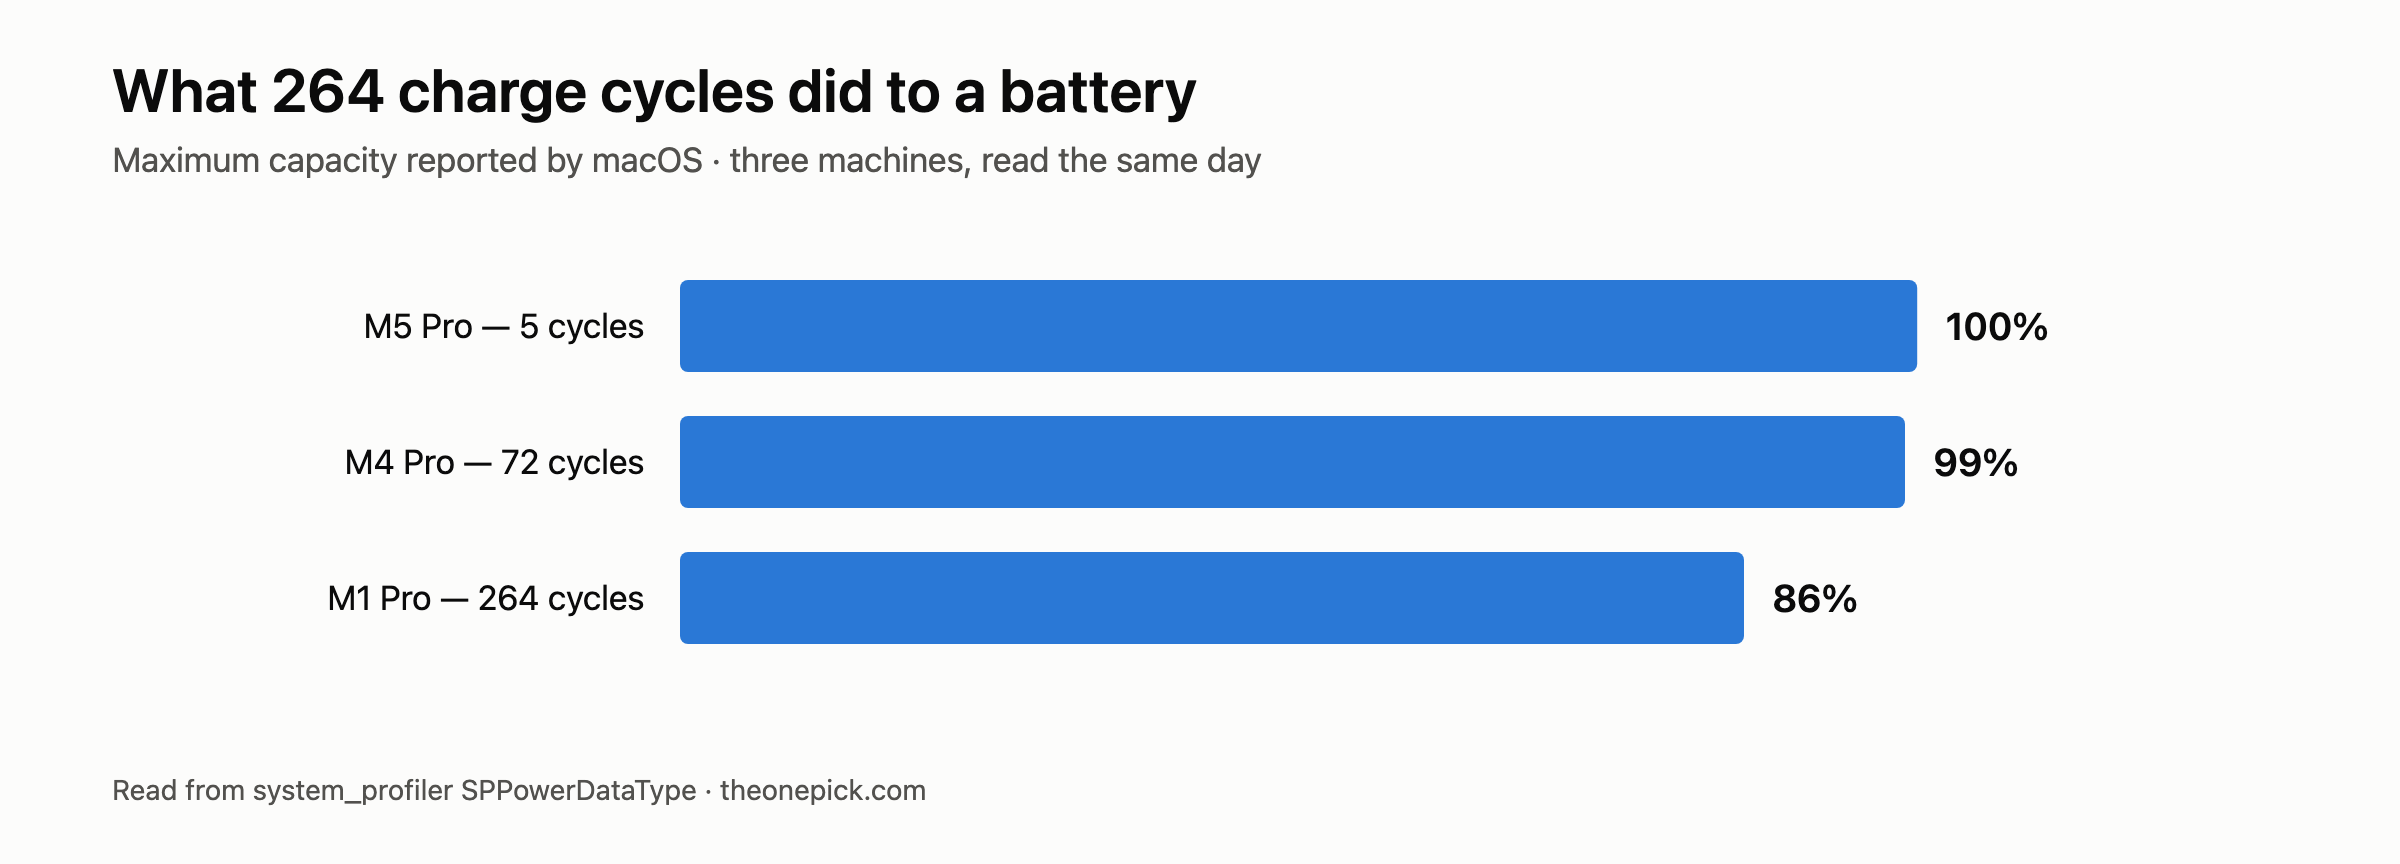
After 264 charge cycles and roughly four years of daily use, our M1 Pro reports 86% of its original battery capacity. A near-new M4 Pro at 72 cycles reports 99%, and an M5 Pro at 5 cycles reports 100%. Those three numbers are the whole article, and they are worth more than any manufacturer estimate because they came off machines someone actually used.
The three points we have
| Cycles | Maximum capacity | Age | |
|---|---|---|---|
| M5 Pro 16″ | 5 | 100% | New |
| M4 Pro 14″ | 72 | 99% | Under a year |
| M1 Pro 14″ | 264 | 86% | Roughly four years |
Apple’s published guidance for recent MacBook Pro batteries is that they are designed to retain 80% of original capacity at 1,000 complete charge cycles. Our M1 Pro is at 264 cycles and 86%, which is well inside that curve — it has used about a quarter of its rated cycle life and lost 14 percentage points of capacity.
If the loss were linear, 264 cycles costing 14 points would put the machine at 80% somewhere around 380 cycles, far short of the 1,000-cycle design target. Battery degradation is not linear, and the early drop is normally the steepest part, so we would not extrapolate from this. But it is a useful correction to the mental model most people carry, which is that capacity ticks down evenly and you have plenty of runway.
What we could not measure, and why it matters here
Three machines is three data points, not a curve, and these three were not used the same way. The M1 Pro has spent four years as somebody’s daily machine — plugged in at a desk much of the time, unplugged and drained on other days. The other two have barely been cycled. We have no log of how any of them were charged, how hot they got, or how often they sat at 100% on a charger.
That matters because charging habits drive degradation as much as cycle count does. A battery kept at full charge in a warm room ages faster than one that spends its life between 30% and 80%. We cannot tell you which of those histories our M1 Pro had, so treat 86% at 264 cycles as one real machine’s outcome rather than a rate you can apply to yours.
What it is good for is calibration. If your four-year-old MacBook Pro reports something close to 86%, you are in ordinary territory. If it reports 70%, something in your usage or your unit is different, and that is worth looking into.
Does the old battery slow the machine down?
No — we tested it, and it did not. We ran our full benchmark set on the M1 Pro plugged in and again on battery, and every result landed within 1.5% of the other. A four-year-old battery at 86% capacity delivered full performance unplugged. What a worn battery costs you is runtime, not speed. We wrote that test up separately.
Cycles accumulate slower than you think
The three machines also tell you something about pace. A charge cycle is one full battery’s worth of discharge, not one plug-in — draining 50% twice counts as one cycle.
| Cycles | Roughly | |
|---|---|---|
| M5 Pro | 5 | Days of use |
| M4 Pro | 72 | Under a year |
| M1 Pro | 264 | About four years |
That puts our M1 Pro at roughly 65 cycles a year. At that pace, Apple’s 1,000-cycle design target is fifteen years away — long past the point where anything else on the machine matters. For most people the battery’s calendar age and charging habits will decide its condition, not the cycle counter.
This also explains why our M4 Pro sits at 99% after 72 cycles while the M1 Pro has dropped 14 points at 264. The gap is not four times the wear; the early cycles cost very little and the loss steepens later.
A note on how these were read
Unlike the performance figures elsewhere on this site, these are single readings, not repeated measurements. Battery capacity and cycle count are counters macOS maintains, not something we timed three times and took a median of. There is no run-to-run spread to report because there are no runs.
That also means they carry a different kind of uncertainty. The percentage is macOS’s own estimate of remaining capacity, derived from the battery’s charge controller — we are reporting what the machine says about itself, not an independent measurement of the cell.
How to read your own number
Apple menu → System Settings → Battery → Battery Health. The percentage is maximum capacity relative to when the battery was new. For cycle count, hold Option and click the Apple menu, choose System Information, then Power.
One command gives you both:
system_profiler SPPowerDataType | grep -E "Cycle Count|Maximum Capacity|Condition"
The Condition line is the one to watch. Normal means the battery is working as expected regardless of what the percentage says. Anything else — Service Recommended in particular — is macOS telling you the battery has a problem beyond ordinary wear, and that is a different situation from a low capacity number.
When the number actually means replace it
Capacity percentage on its own is a weak trigger. Our M1 Pro at 86% still runs a full day of light work. The questions that matter are practical:
- Does it still last long enough for how you work? If you are near power most of the day, 86% is irrelevant to you.
- Does it shut down unexpectedly under load? That is a current-delivery problem and it is a real reason to act, whatever the percentage reads.
- Does macOS say Service Recommended? Then the percentage is beside the point.
What is not a reason: a number below 100%. Every battery starts losing capacity immediately, and the first few points go quickly. Our M4 Pro is at 99% after 72 cycles.
What we will measure next
The gap in this article is runtime. We have capacity percentages but we have not yet measured how long each machine actually lasts on a charge under a controlled load — which is the number that would let us say what 86% costs you in hours rather than percentage points. That test takes a full discharge per machine and we have not run it yet. When we do, it goes here.
Measured 14 September 2026. MacBook Pro 16-inch M5 Pro (48GB/1TB, macOS 26.6.2), MacBook Pro 14-inch M4 Pro (48GB/1TB, macOS 26.6.2), MacBook Pro 14-inch M1 Pro (16GB/512GB, macOS 26.5.1). Battery figures read from system_profiler SPPowerDataType.
All the numbers in this article come from the same test run. See the full three-generation comparison.