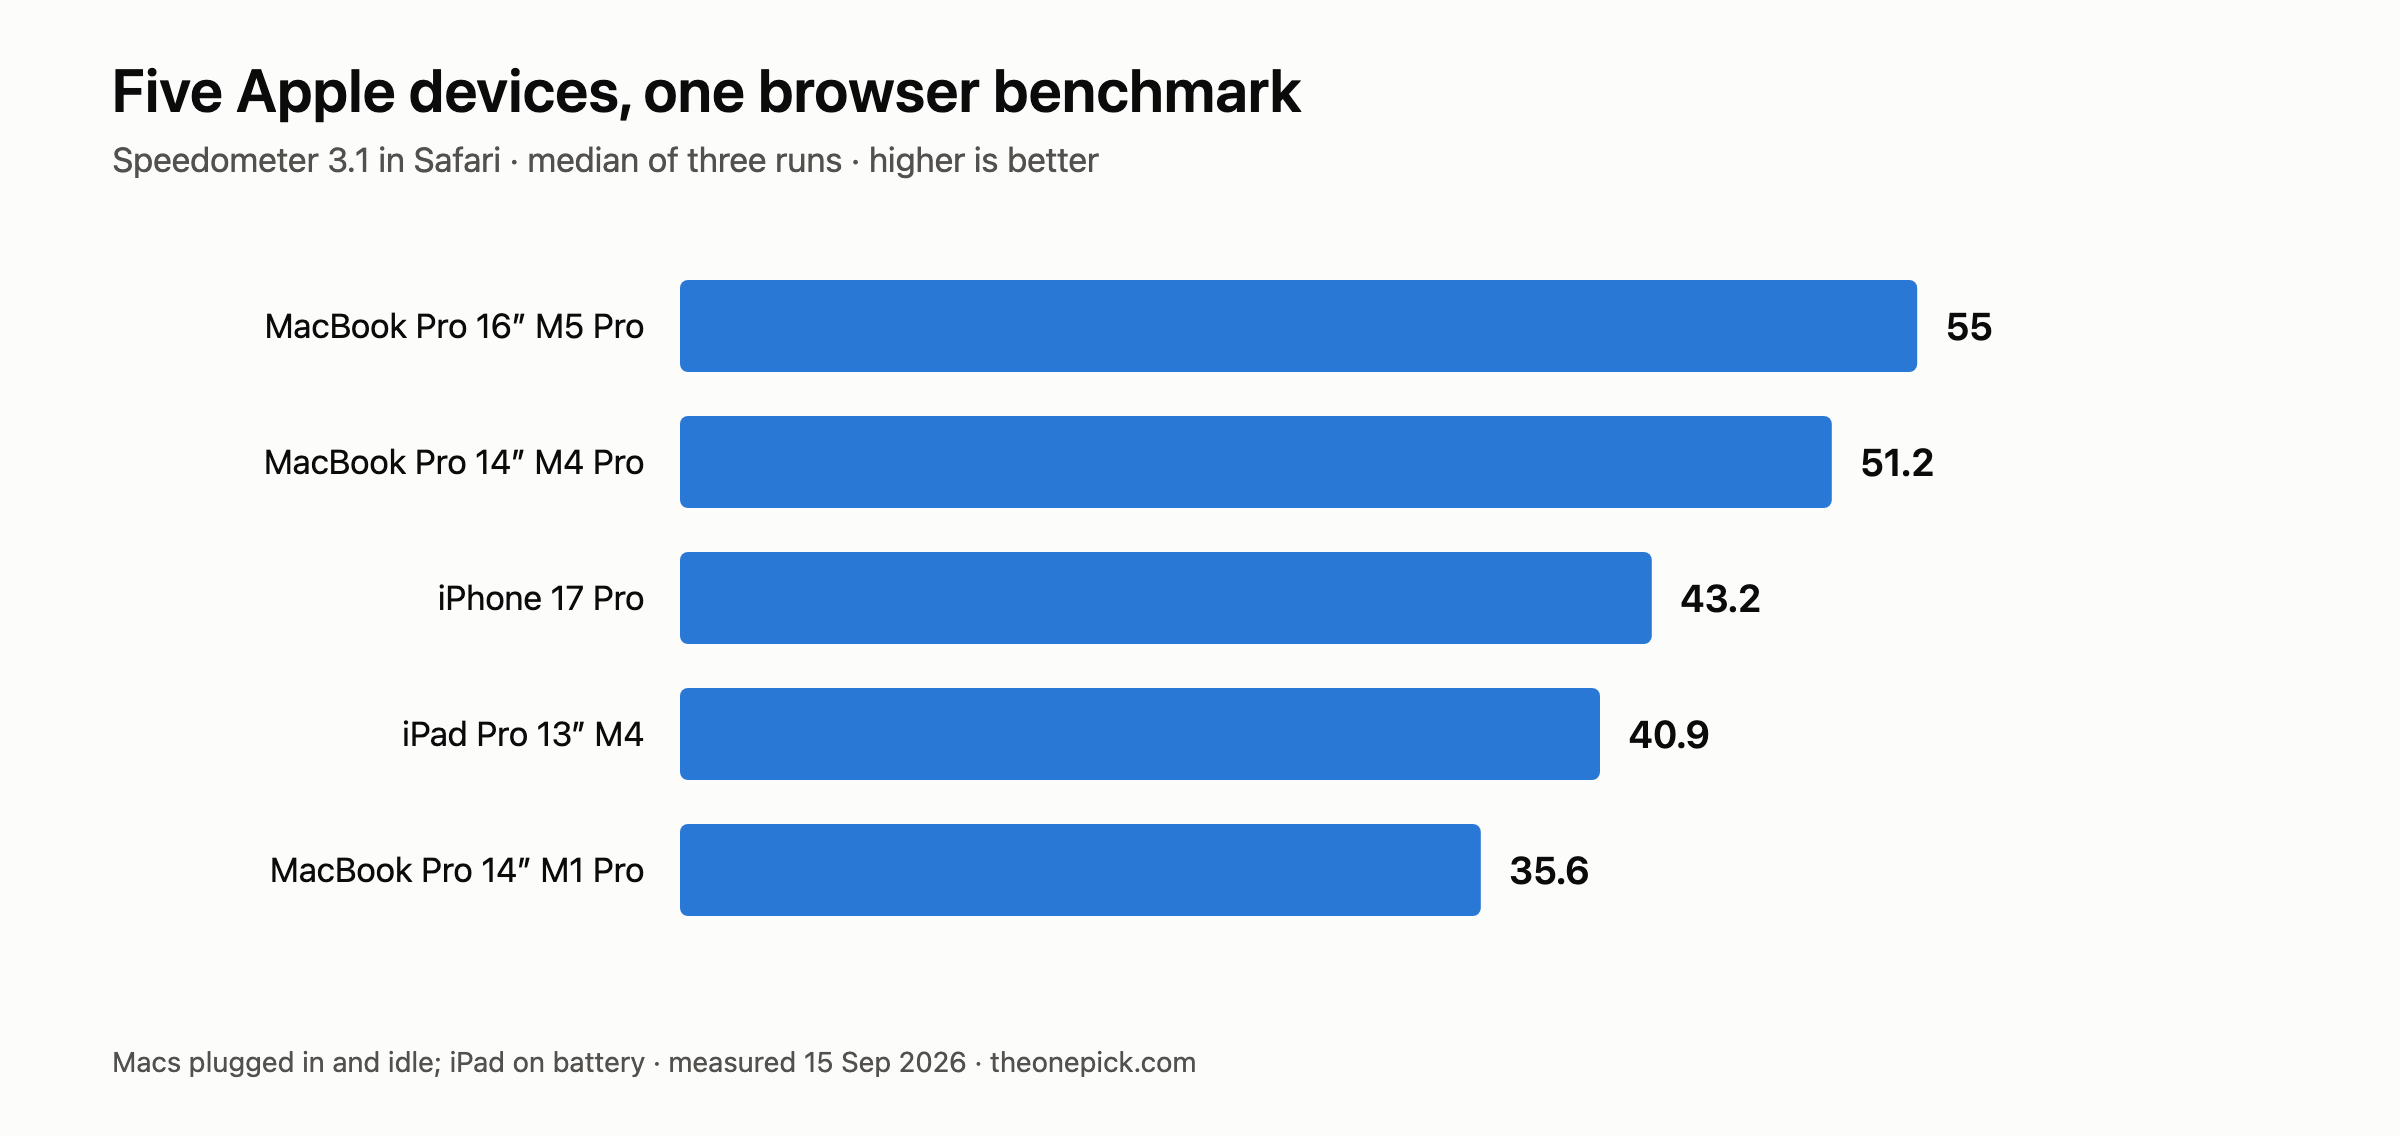
We ran the same browser benchmark on five Apple devices we own, and a phone finished ahead of a 13-inch iPad Pro. The margin was thin enough that we will not call it a win — but a $1,299 tablet and a phone landing in the same class was not the result we expected, and neither was what came below them.
The ranking
Speedometer 3.1 in Safari, three runs per device, median reported.
| Score | Run-to-run spread | OS | |
|---|---|---|---|
| MacBook Pro 16″ M5 Pro | 55.0 | 2.7% | macOS 26.6.2 |
| MacBook Pro 14″ M4 Pro | 51.2 | 3.1% | macOS 26.6.2 |
| iPhone 17 Pro | 43.2 | 5.3% | iOS 26.6.2 |
| iPad Pro 13″ M4 | 40.9 | 1.2% | iPadOS 26.6.1 |
| MacBook Pro 14″ M1 Pro | 35.6 | 18.5% | macOS 26.5.1 |
Higher is better. Speedometer measures how quickly a browser handles the kind of work a web application does — it is a responsiveness test, not a measure of raw compute.
About that phone-versus-tablet result
The iPhone measured 5.6% ahead of the iPad Pro. Our run-to-run spread on the iPhone was 5.3%.
The gap is barely larger than the noise, which means we can report that the iPhone came out ahead in our testing but we cannot tell you it is reliably faster. Run both again tomorrow and the order could flip. What the numbers support is that a phone and an M4 iPad Pro are in the same performance class for browser work, which is the part worth knowing.
We are spelling this out because the temptation to write the headline the other way is real, and the 0.3 percentage points between our gap and our noise floor is exactly the kind of margin that gets rounded up into a claim it cannot carry.
The part that is not close
The same M4 generation appears twice on that list in very different positions. An M4 Pro MacBook scored 51.2; an M4 iPad Pro scored 40.9. The laptop is 25% ahead.
Two things are mixed into that gap. We cannot tell you which one dominates, because separating them needs hardware we do not own:
- Chip tier. M4 Pro is not M4. More cores, more memory bandwidth.
- Platform. Safari on macOS and Safari on iPadOS are different builds with different resource limits.
We did not test an M4 MacBook Air or an M4 Pro iPad, either of which would isolate one variable. So we are reporting the combined result, which is also the one you experience: if you use both devices for web work, the laptop feels faster, and 25% is roughly how much.
The oldest machine is also the least consistent
Look at the spread column rather than the scores for a moment.
| Spread | |
|---|---|
| iPad Pro 13″ | 1.2% |
| M5 Pro 16″ | 2.7% |
| M4 Pro 14″ | 3.1% |
| iPhone 17 Pro | 5.3% |
| M1 Pro 14″ | 18.5% |
The fanless tablet produced the tightest results of anything we own. Three runs landed between 40.6 and 41.1 with no warming-up trend at all.
The four-year-old MacBook Pro produced by far the loosest. Its three runs were 35.6, 29.2 and 35.79 — two in close agreement and one 18% below them, taken immediately after the first while the machine was still warm. A ten-minute cooldown brought it back. We ran a separate eight-minute sustained-load test on that machine to see whether it throttles, and it did not, so the dip remains unexplained.
We left the outlier in the spread figure rather than discarding it. Dropping an inconvenient run because it is inconvenient is how measurements become stories. The honest consequence is that the M1 Pro is now the device where we can detect the least: any future change smaller than 18.5% on that machine is invisible to us.
What the spread column is actually for
It sets the floor on what we are allowed to say later.
We captured these numbers deliberately before updating any of these devices to this year’s OS releases. When we re-run them afterwards, the spread decides whether a difference is a finding or noise:
| A change must exceed | |
|---|---|
| iPad Pro 13″ | 1.2% |
| M5 Pro 16″ | 2.7% |
| M4 Pro 14″ | 3.1% |
| iPhone 17 Pro | 5.3% |
| M1 Pro 14″ | 18.5% |
Anything under those thresholds, we will report as “we could not measure a difference” — which is a real answer, and one that most update coverage never gives.
What we could not test
Speedometer is one benchmark measuring one thing. Treat this ranking as what it is — browser responsiveness on five specific units on two days — and not as a general statement about how fast these devices are.
- We did not isolate chip tier from platform. The 25% gap between the M4 Pro laptop and the M4 tablet mixes two variables. Separating them needs an M4 MacBook Air or an M4 Pro iPad, and we own neither. Our explanation of that gap is interpretation, not measurement.
- We did not test anything except the browser. These scores say nothing about video export, compilation, or gaming. On other workloads we measured, the same machines ranked differently by as much as 70 percentage points.
- We did not control OS version. Three different OS releases appear in the table, and the M1 Pro is a point release behind the other Macs. Some of the spread between devices is software.
- We have one unit of each. Manufacturing variation between units of the same model is not something five devices can tell us anything about.
Where we have gone past the numbers — the phone-and-tablet-are-in-the-same-class reading, the suggestion that the fanless design explains the iPad’s consistency — that is us reasoning, and we are flagging it as reasoning. The measurements are the five medians and the five spreads. Everything else in this article is our interpretation of them.
Conditions, and one gap in them
Every device ran Speedometer 3.1 from browserbench.org in Safari, three times, with two minutes between runs to let heat dissipate.
The three MacBook Pros were plugged in, idle, with applications closed. The iPad Pro was on battery, which is a difference from the Macs we should flag. In separate testing on the M1 Pro we found the gap between mains and battery power was under 1.2% across four workloads, so we do not think it moved the iPad result meaningfully — but we did not verify that on the iPad itself, so it stays on the record as an untested assumption.
We also failed to record whether the iPhone was charging during its runs. That is our mistake, not a judgement call, and it is noted here rather than quietly omitted.
Devices: MacBook Pro 16-inch M5 Pro (48GB/1TB), MacBook Pro 14-inch M4 Pro (48GB/1TB), MacBook Pro 14-inch M1 Pro (16GB/512GB), iPhone 17 Pro (MG7K4LL/A), iPad Pro 13-inch M4 (MVX33LL/A, 256GB). Measured 15 September 2026.
Check it yourself
Open browserbench.org in Safari on any device, choose Speedometer 3.1, and press Start Test. It takes a few minutes and needs nothing installed.
Two things matter if you want a number you can compare against ours: run it three times with a couple of minutes between, and close everything else first.
On a Mac you can confirm the machine is actually idle before you start:
sysctl -n vm.loadavg
ps -Aceo pcpu,comm -r | head -5
If the load average is not close to zero, you are partly measuring your own desktop. On one of our Macs, leaving a browser and a virtual machine running cost 20% and made a newer laptop look slower than an older one.
All the numbers in this article come from the same test run. See the full three-generation comparison.