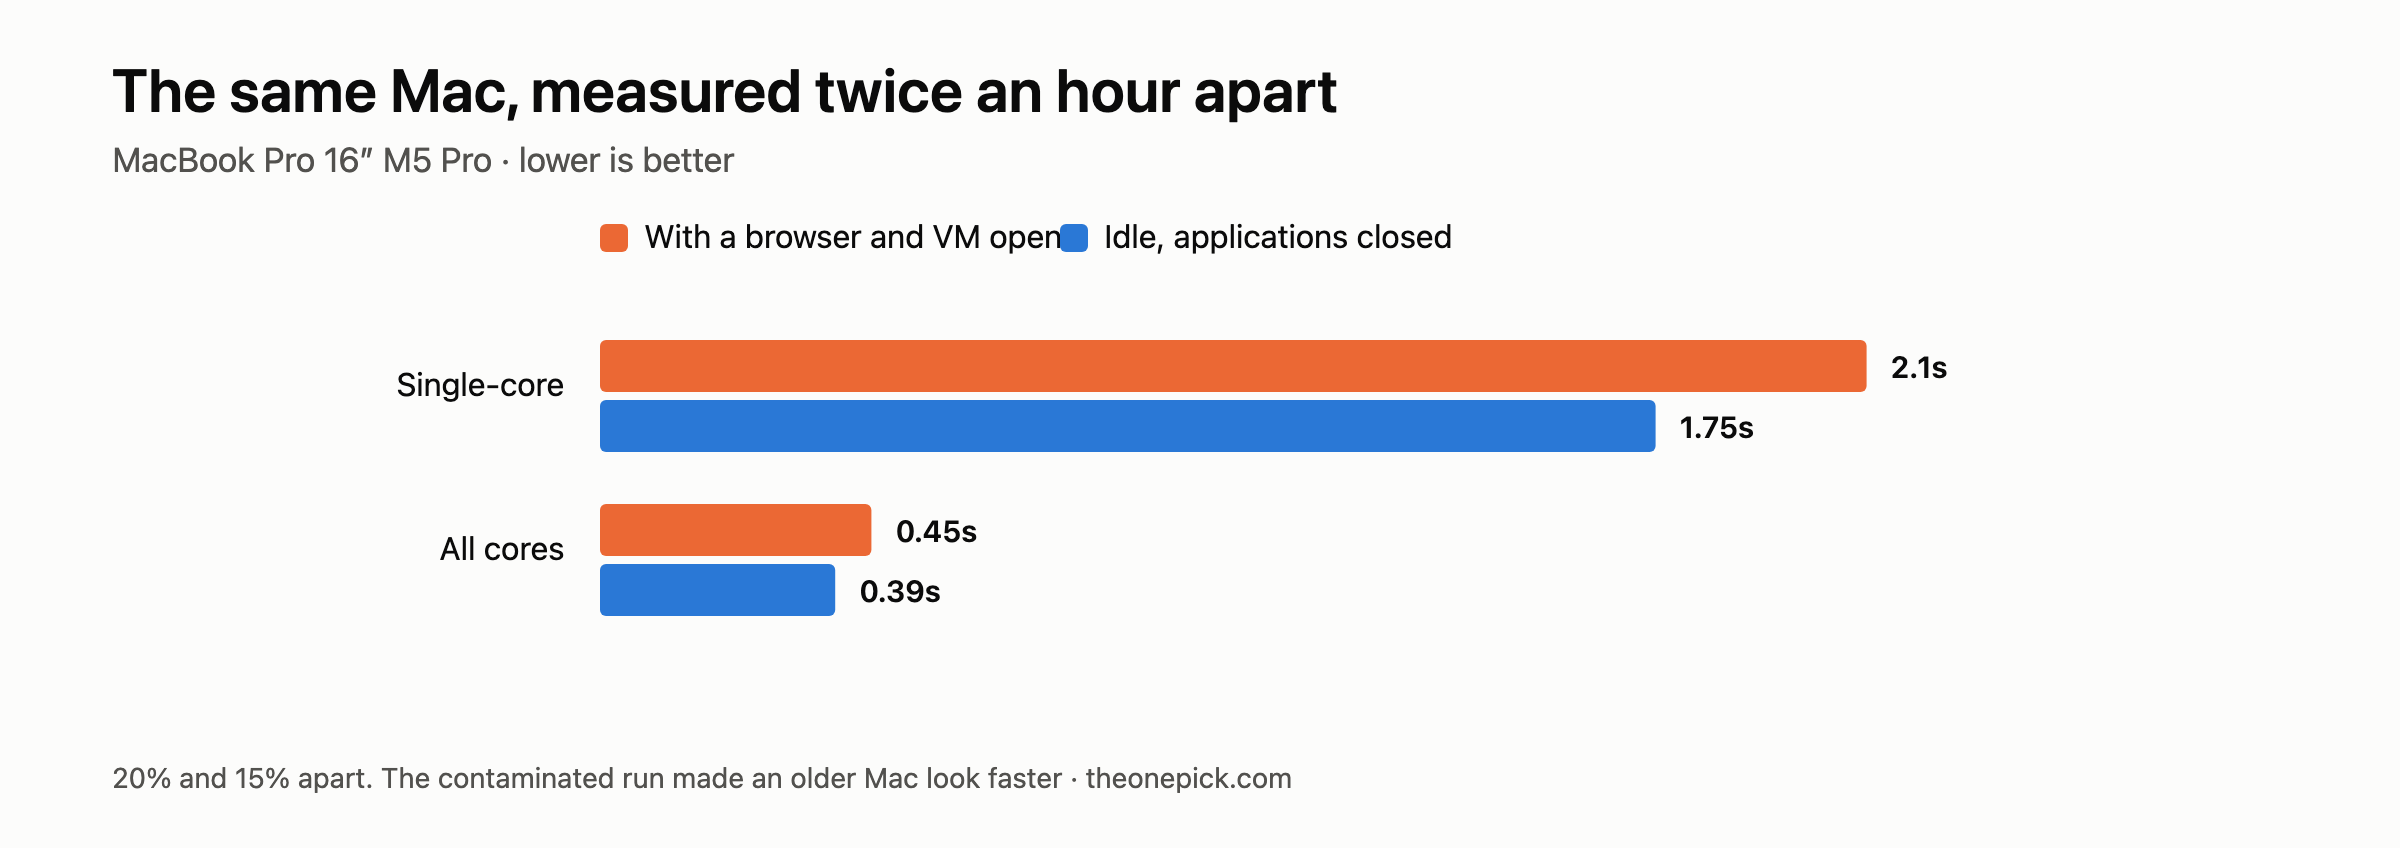
We benchmarked the same MacBook Pro twice, an hour apart, and got results 20% apart. The machine did not change. What was running on it did.
Worse, the contaminated run produced a conclusion that was flatly wrong: it showed the older M4 Pro beating the newer M5 Pro. We nearly published that.
The two runs
Same machine — a 16-inch M5 Pro, plugged in, same macOS build, same benchmark, same day. The only difference was what else was open.
| In normal use | Idle | Gap | |
|---|---|---|---|
| Single-core compression | 2.10s | 1.75s | 20.0% |
| All-core compression | 0.45s | 0.39s | 15.4% |
| Passes completed in 8 min | 1,096 | 1,215 | 9.8% |
| Run-to-run spread, all-core | ±21.0% | ±1.5% | 14x tighter |
“In normal use” meant a browser with 89 processes, three external displays driving the window server, a virtualisation service, and the editor we were working in. Nothing exotic. That is a Tuesday.
The last row is the one that should worry anyone comparing numbers. The contaminated run was not just slower — it was unstable. A ±21% spread across three runs means the median is nearly meaningless; run it again and you get a different answer.
The wrong conclusion it produced
We had already measured a 14-inch M4 Pro, idle, with nothing open. When we put the two machines side by side:
| Single-core | All-core | 8-min passes | |
|---|---|---|---|
| M4 Pro 14″ (idle) | 1.90s | 0.42s | 1,148 |
| M5 Pro 16″ (in use) | 2.10s | 0.45s | 1,096 |
Read at face value, the newer, larger, more expensive machine loses on every line. That result is not a surprising finding about Apple silicon. It is an artifact of measuring one machine while working on it and the other while it sat untouched.
When we closed everything on the M5 Pro and ran it again, the order corrected itself: 1.75s against 1.90s single-core, 0.39s against 0.42s all-core, 1,215 passes against 1,148. The M5 Pro is 6% to 9% ahead, which is the real and much less dramatic answer.
The wrong result was more interesting than the right one. That is exactly why it is dangerous — a benchmark that overturns expectations gets shared, and this one would have been shared while being entirely an accident of method.
Why a browser costs 20%
The intuition that trips people up is that a modern machine has cores to spare, so a few background apps should not matter. On an 18-core laptop that feels especially safe.
It is not, for two reasons.
Single-threaded work has nowhere to hide. A single-core benchmark occupies exactly one core. If the scheduler moves that thread, or interrupts it for something else, the benchmark absorbs the cost directly. More cores do not help a workload that can only use one.
All-core work is competing for every core at once. The all-core test is trying to use all eighteen. Anything else running is subtracting from the same pool, and the subtraction is unpredictable — which is why the spread blew out to ±21%.
Background load does not reduce your machine’s capability. It reduces how much of that capability the measurement can see, and it makes the measurement wobble.
What to close, in order
Not everything matters equally. From our two runs, in descending order of impact:
- The browser. Ours had 89 processes alive. It was the largest single contributor.
- Anything virtualised. A running VM holds real cores whether or not you are using it.
- Editors, sync clients, chat. Individually small, collectively not.
- External displays — but see below.
We deliberately did not disconnect our three external displays. Unplugging them would have produced a cleaner number and an unrepeatable one: we would never reproduce that exact setup again for an after-the-update comparison. The goal is a condition you can recreate, not the fastest possible number. “Three displays connected, browser closed, VM closed” is something we can set up again in six months. “Everything unplugged and rebooted” is not, and it does not describe anyone’s real machine either.
The rule we adopted
Record the state, then reproduce the state. We now capture the background load with every benchmark run: load average, process count, browser process count, display count, and what was deliberately closed. When we re-run after a macOS update, we match that list.
This costs nothing and it is the only thing standing between us and another 20% mistake. A benchmark number without the conditions attached is not a result; it is an anecdote.
What we did not establish
Two runs on one machine is a demonstration, not a characterisation.
- We did not isolate which application cost what. We closed the browser and the virtualisation service together and re-measured. We cannot tell you the browser alone was worth 15 points and the VM 5 — that would need one variable at a time, and we did not do it. The 20% is the combined effect of everything we closed.
- We did not test other machines. The M4 Pro and M1 Pro were measured idle from the start, so we have no loaded-versus-idle pair for them. Whether the penalty is larger or smaller on a machine with fewer cores is an open question we would expect to matter. We did not measure it.
- We did not repeat the loaded condition. Background load is not a fixed quantity; a browser with 89 processes today is not the same load as one with 89 processes tomorrow. The 20% figure is one observation of a moving target.
Where we are reasoning rather than measuring, we will say so: our explanation below of why a browser costs 20% is our interpretation of the numbers, not something we tested directly. We did not instrument the scheduler. The measurement is the gap and the spread; the mechanism is our reading of it.
How to check your own conditions
Before you run anything you intend to compare:
sysctl -n vm.loadavg          # the three load averages
ps -Aceo pcpu,comm -r | head  # what is actually using the CPU
If the load average is not near zero, whatever you measure next is partly a measurement of your own desktop. Take a note of both, run the benchmark three times rather than once, and look at the spread — if your three runs disagree by more than a few percent, the number is not ready to compare against anything.
That last check would have caught our error on its own. Our contaminated all-core runs disagreed by 21%. We should have stopped there instead of writing the median down.
Measured 14 September 2026 on a MacBook Pro 16-inch M5 Pro (48GB/1TB, macOS 26.6.2 build 25G83), plugged in, using zstd 1.5.7 on a locally generated 512MB file. Three runs per condition, median reported.
The corrected numbers, and the comparison they belong to, are here.