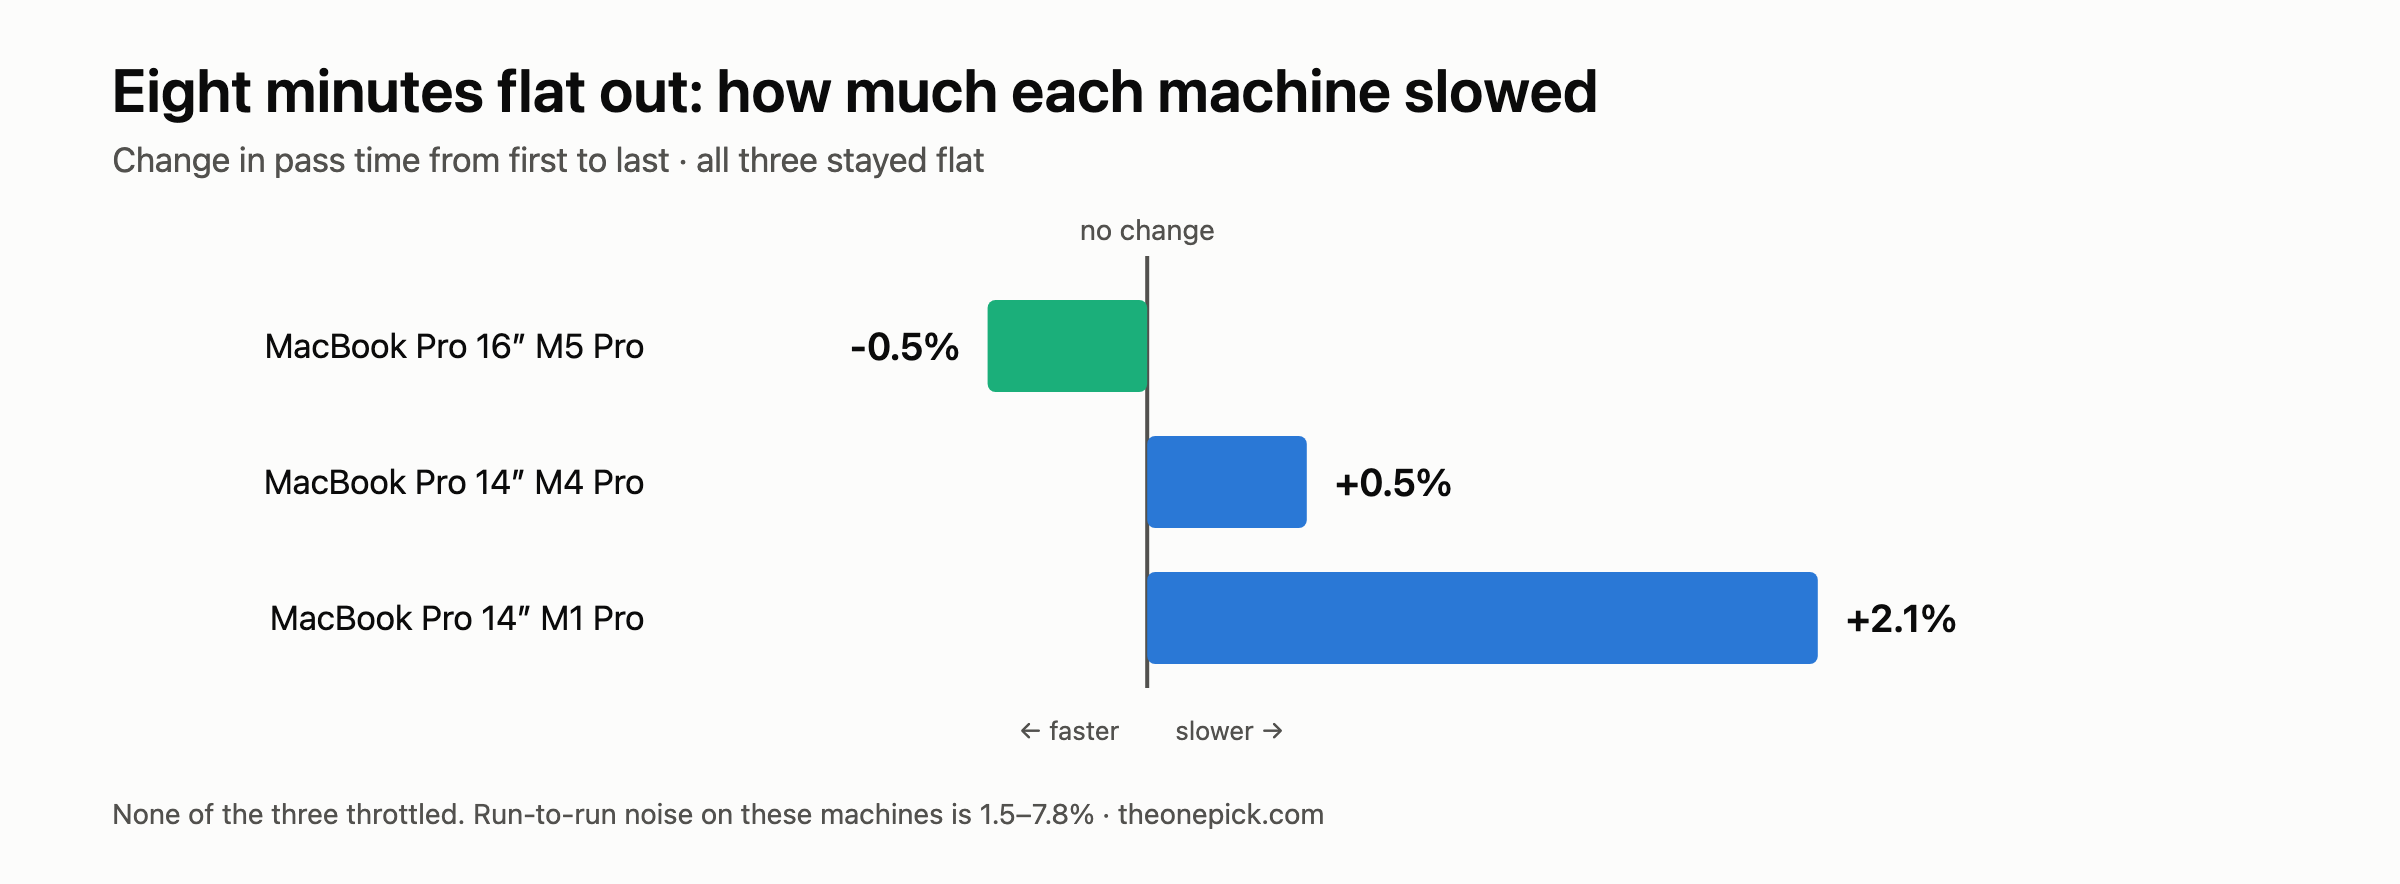
We ran three MacBook Pros flat out for eight minutes each and none of them slowed down. The oldest machine, a four-year-old 14-inch M1 Pro, finished its last pass 2.1% slower than its first. The newest finished 0.5% faster. On this workload, thermal throttling did not happen.
We went in expecting the opposite, and the story of why is the useful part.
The test
Each machine compressed the same locally generated 512MB file across all cores, on repeat, for eight minutes. We timed every pass. If a machine throttles under sustained load, the passes get slower as heat builds — you can see it without any special instrumentation, in the unit that actually matters to you.
| Passes in 8 min | First pass | Last pass | Change | |
|---|---|---|---|---|
| M5 Pro 16″ | 1,215 | 0.412s | 0.410s | -0.5% |
| M4 Pro 14″ | 1,148 | 0.420s | 0.422s | +0.5% |
| M1 Pro 14″ | 562 | 0.856s | 0.874s | +2.1% |
Negative means it got faster. All three are flat within the noise we see between runs on the same machine.
Note the middle machine especially. The M4 Pro is a 14-inch chassis — the smaller cooling system — and it held completely level for eight minutes while doing more total work than the 16-inch M1 Pro. Chassis size did not decide this.
This test is unusual on this site in that it does not report a median of three runs. It is the repetition: 1,215 consecutive passes on the fastest machine, 562 on the slowest. The first and last pass are what we compare, and every pass in between is on record. A single slow pass would not move the result; a machine that was heating up would show a trend across hundreds of them.
Why we thought we would find throttling
Earlier the same day, the M1 Pro produced a result that looked like textbook thermal behaviour. We ran a browser benchmark three times:
| Run | Score | Conditions |
|---|---|---|
| 1 | 35.6 | From cold |
| 2 | 29.2 | Immediately after run 1 |
| 3 | 35.79 | After a 10-minute cooldown |
Run 2 came in 18% below run 1, and a cooldown brought it all the way back. Two runs from a cool machine agreed within 0.5% of each other; the one run taken while the machine was still warm was the outlier. That is what heat looks like.
So we built the eight-minute test specifically to confirm it — a much harsher load than a browser benchmark, run for far longer, on the machine we suspected.
It did not reproduce. Eight minutes of every core pinned, and the M1 Pro lost 2.1%.
What we concluded
The hypothesis failed, so we dropped it. We cannot tell you the M1 Pro throttles under sustained load, because when we tried to make it throttle on purpose, it did not.
That leaves the 18% dip unexplained. The honest possibilities:
- Background activity. Something else on the machine took CPU during that run. We did not capture the process list at that moment, which is the mistake we will not repeat.
- A different thermal path. A browser benchmark drives the display and GPU alongside the CPU; all-core compression does not. It is possible to heat one part of a machine and not another.
- Ordinary variance. Browser benchmarks are noisier than compression. But 18% is a lot of variance, and two cold runs agreeing within 0.5% argues against it.
We have no way to choose between those with the data we have, so we are not choosing. The dip is recorded, the eight-minute test is recorded, and they disagree.
What this means for buying a 14-inch
The common advice is that the 14-inch chassis throttles and the 16-inch does not, so anyone doing sustained work should size up. Our measurements do not support that, on this workload.
Both 14-inch machines held their speed for eight minutes. The 16-inch M5 Pro finished more passes than either, but that is because it is faster per pass, not because it degraded less. Every machine’s last pass was within 2.1% of its first.
What we have not tested is longer. Eight minutes is a real load but it is not a two-hour export. Thermal mass buys you the first several minutes; a sustained-throttling story would more likely show up at thirty minutes or an hour. If you routinely run loads measured in hours, this test does not answer your question and you should not take it as though it does.
One methodological trap worth avoiding
Our first attempt at measuring throttling looked for CPU_Speed_Limit in the output of pmset -g therm. That field is an Intel-era counter. On Apple Silicon it is not populated at all — pmset reports “No CPU power status has been recorded” — so a script that reads it will report no throttling, always, on every Apple Silicon Mac, whether or not the machine is throttling.
We caught this because the output looked suspiciously clean on a machine we expected to be struggling. Had we not, this article would have been three confident paragraphs based on a counter that was never being written.
Measuring throughput directly sidesteps the problem entirely. You do not need to know what the hardware is doing internally to know whether your work is getting slower — you just time the work.
How to run this on your own machine
No special tools. Pick something repeatable that uses every core, run it on a loop, and time each iteration:
for i in $(seq 1 100); do
  /usr/bin/time -p zstd -12 -f -q -T0 -o /tmp/out.zst /tmp/bigfile.bin
done
Compare the first few iterations against the last few. If the last ones are meaningfully slower, your machine is throttling on that work. If they are not, it is not — regardless of how warm the chassis feels.
The temperature of the aluminium is not the measurement. The finish time is.
Measured 14 September 2026. MacBook Pro 16-inch M5 Pro (48GB/1TB, macOS 26.6.2), MacBook Pro 14-inch M4 Pro (48GB/1TB, macOS 26.6.2), MacBook Pro 14-inch M1 Pro (16GB/512GB, macOS 26.5.1). zstd 1.5.7, level 12, all threads, on a locally generated 512MB file.
Per-pass speed for each machine is in the generation comparison.