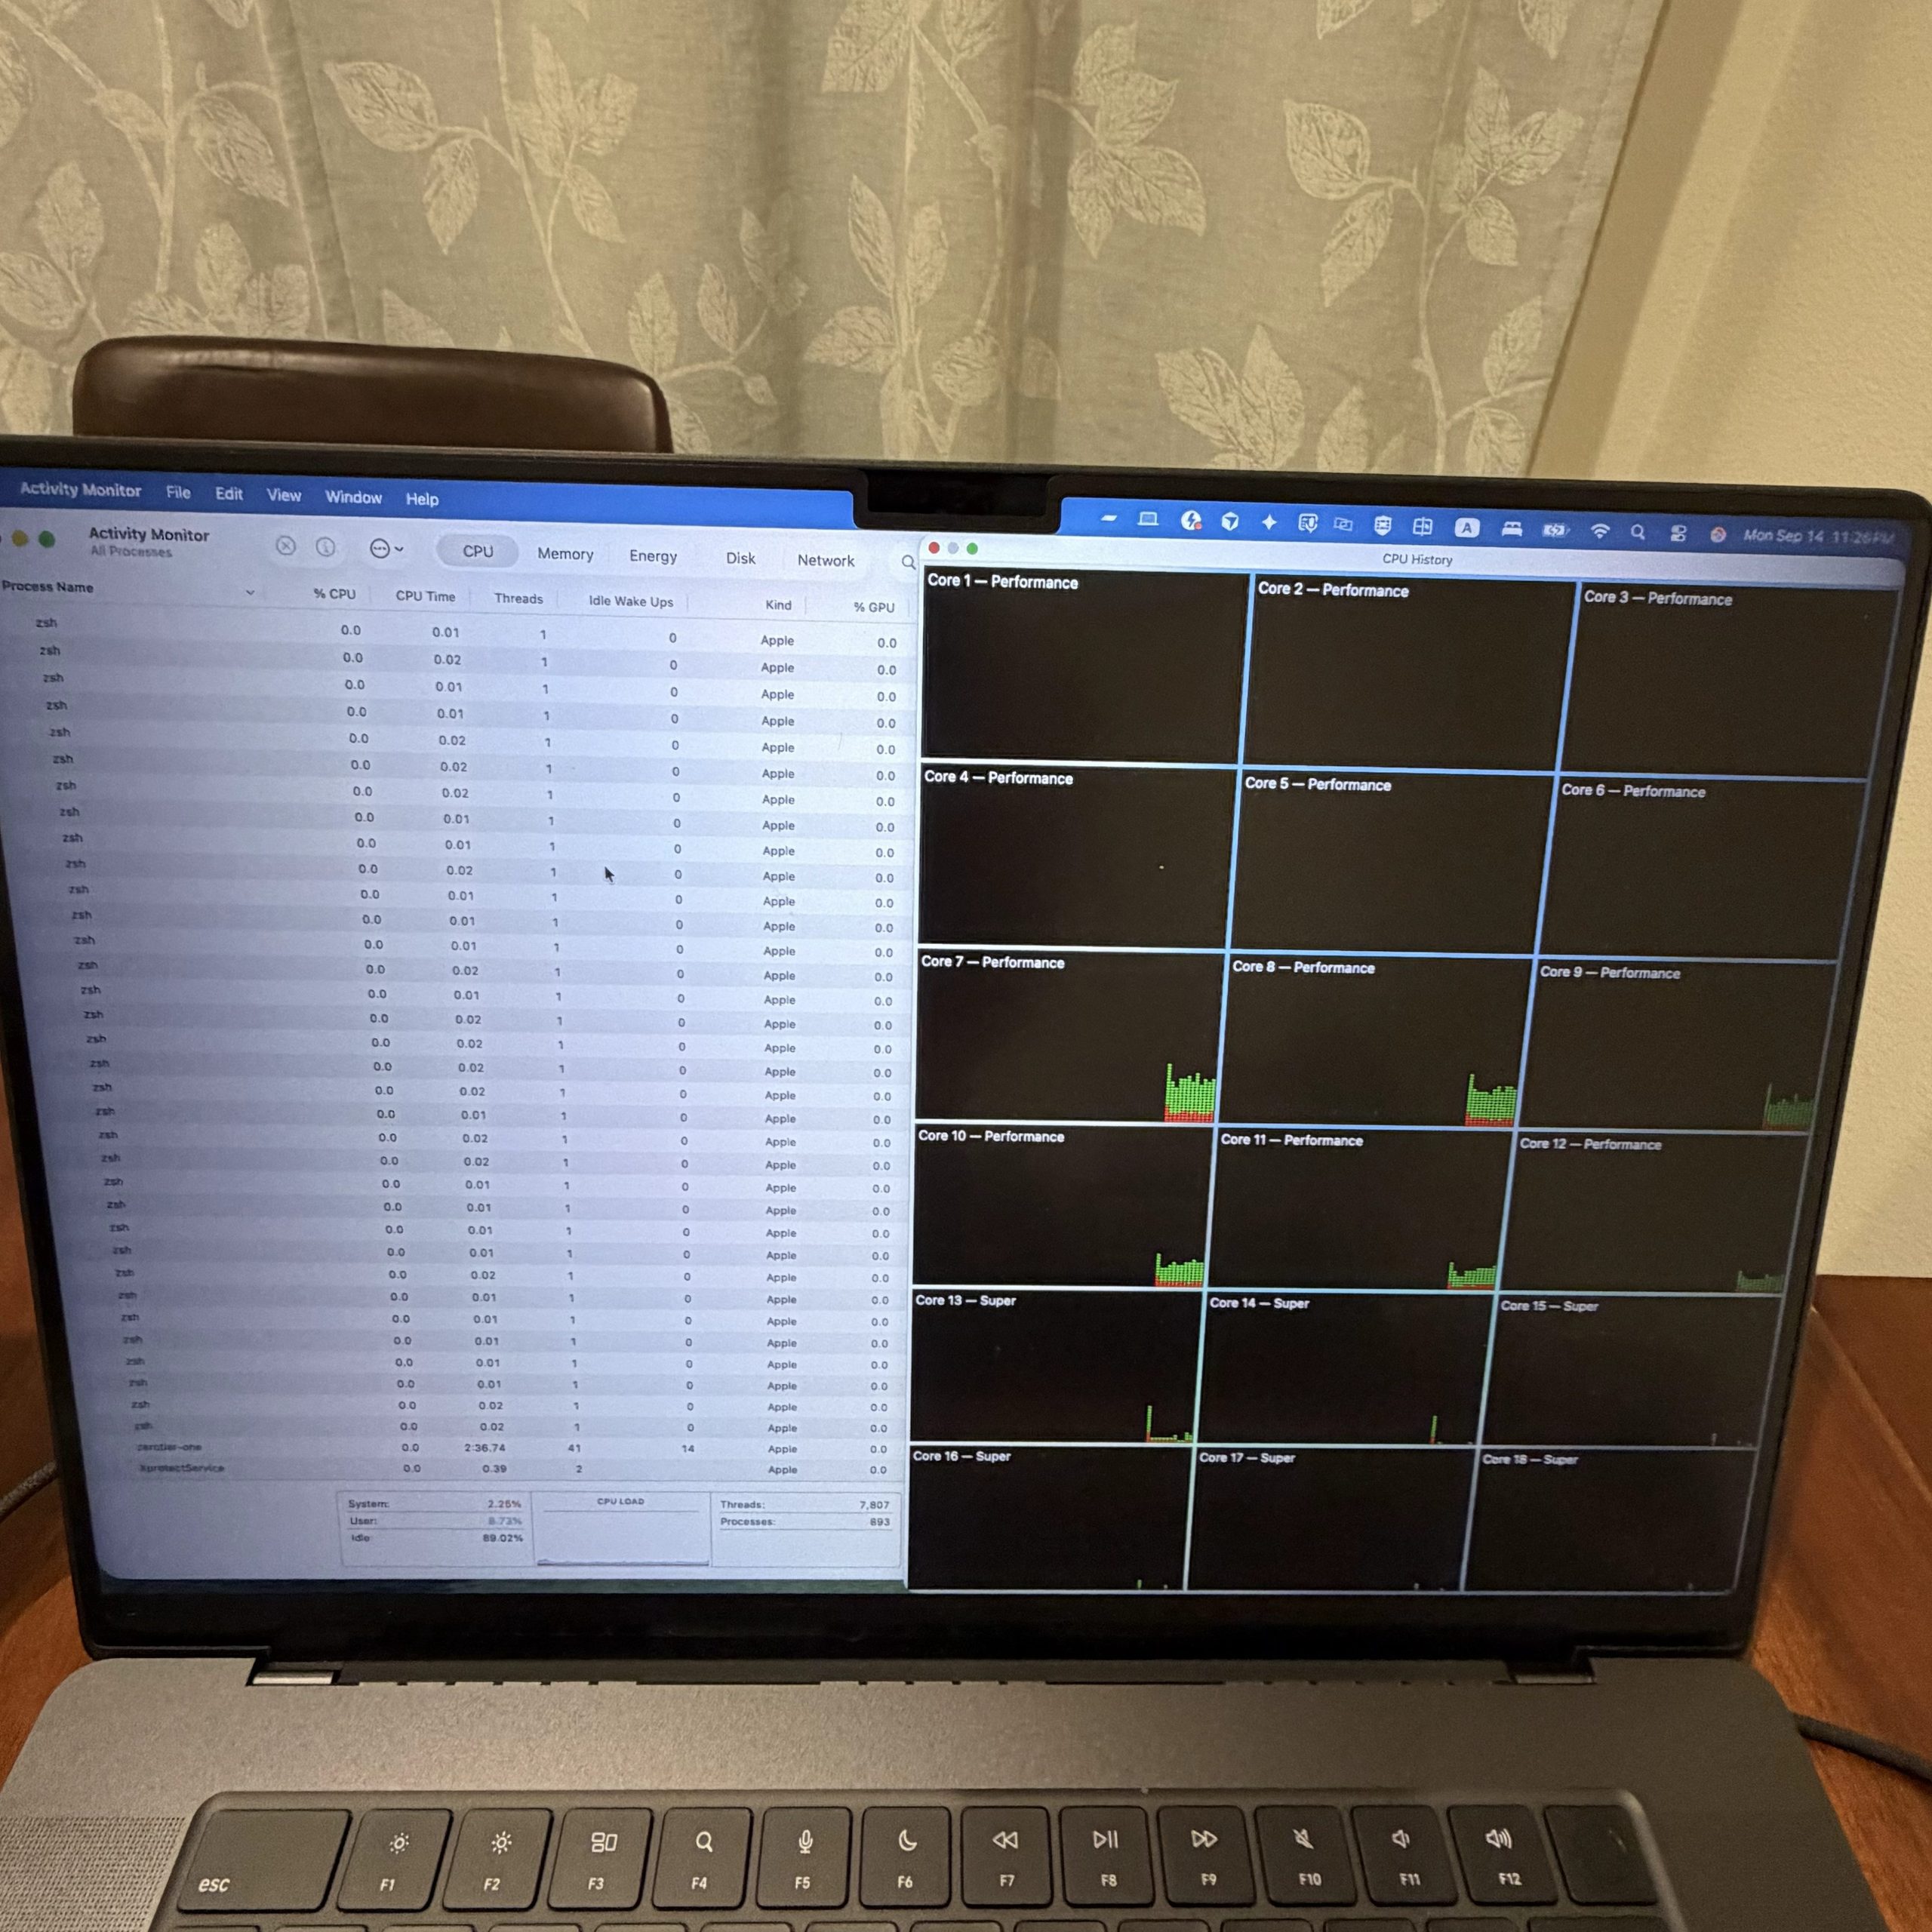
Apple’s specification pages for the M5 Pro list a CPU core count. They do not tell you what the cores are called, and the names turned out to be the interesting part.
Open Activity Monitor’s CPU History window on a 16-inch M5 Pro and you will find eighteen cores in two groups: twelve labelled Performance and six labelled Super. There is no group labelled Efficiency. You can confirm it from the command line without opening anything:
sysctl hw.perflevel0.name    # Super
sysctl hw.perflevel1.name    # Performance
We had two older machines on the same desk, so we checked those too.
What the three generations report
| Cores | Top tier | Second tier | |
|---|---|---|---|
| M1 Pro 14″ | 8 | 6 Performance | 2 Efficiency |
| M4 Pro 14″ | 14 | 10 Performance | 4 Efficiency |
| M5 Pro 16″ | 18 | 6 Super | 12 Performance |
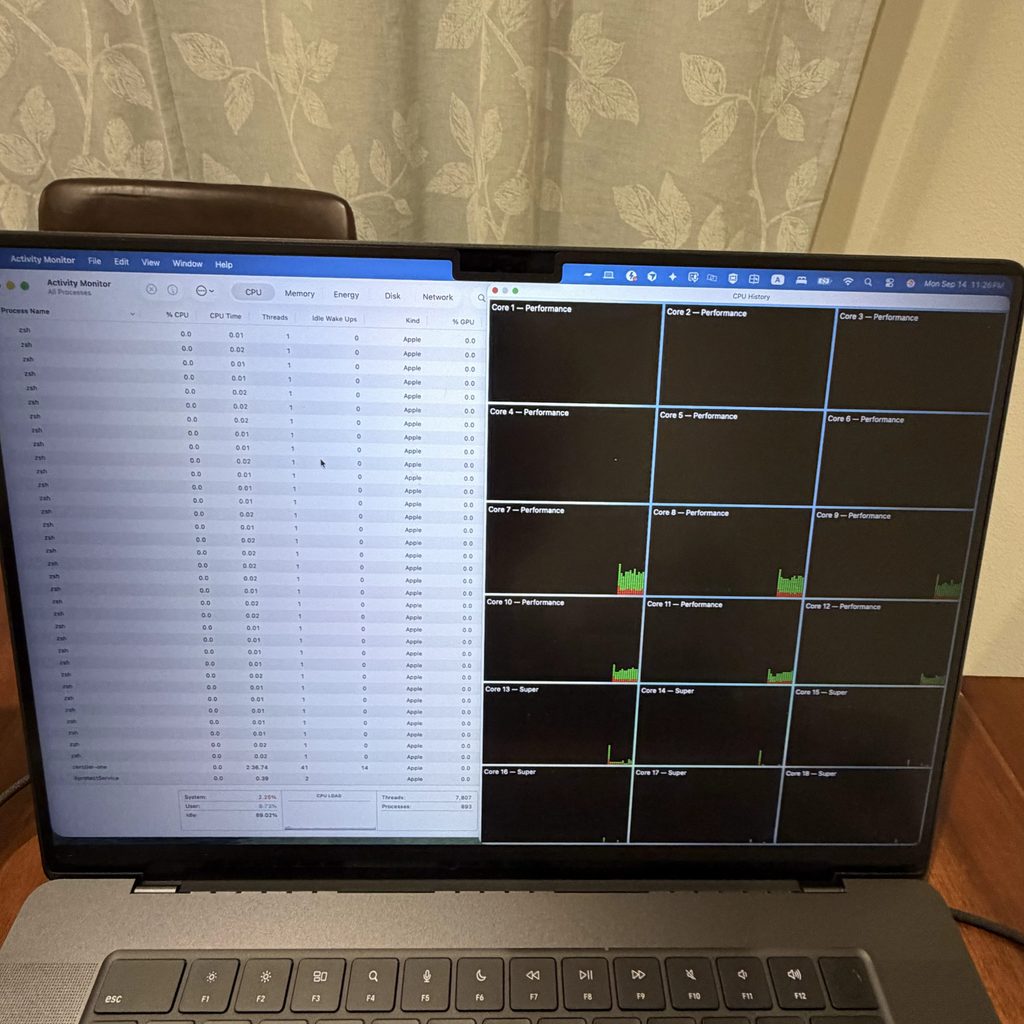
M5 Pro: Cores 1-12 Performance, Cores 13-18 Super.
Two things changed at once. A new top tier appeared with a name macOS has not used before, and the low-power tier stopped being called Efficiency. On the M5 Pro, the twelve cores sitting where efficiency cores used to sit are now labelled Performance.
We want to be careful about what that does and does not tell you. A label is not a measurement. macOS decides what to call a core group; it does not owe us an explanation, and a rename does not by itself prove anything about the silicon underneath. What we can say is that the naming scheme changed between the M4 Pro and the M5 Pro, and that anyone reading a core count off a specification page is reading a number that now means something different from what it meant last year.
What we measured
We did not pin work to specific cores — that is a harder test and we have not built it yet. What we can report is how the three machines behaved on the same workloads, and one result stands out.
We compressed the same 512MB file twice on each machine: once restricted to a single thread, once across every core. The ratio between those two times is how much the machine gained from parallelism.
| Single-thread | All cores | Parallel gain | |
|---|---|---|---|
| M1 Pro (8 cores) | 3.05s | 0.85s | 3.59x |
| M4 Pro (14 cores) | 1.90s | 0.42s | 4.52x |
| M5 Pro (18 cores) | 1.75s | 0.39s | 4.49x |
The M5 Pro has four more cores than the M4 Pro and got no more parallel gain from them. Both land at roughly 4.5x. The M5 Pro finishes faster in absolute terms — 0.39s against 0.42s — but that comes from its single-thread speed, not from scaling better across more cores.
This is one workload, and compression at this level does not scale linearly on any machine. We are not claiming the extra cores are useless; we are reporting that on the work we gave it, eighteen cores did not convert into more parallel gain than fourteen did.
Each figure above is the median of three runs with the machine plugged in and idle, and we recorded the spread between runs. The tightest was 1.3% and the widest 7.8%, so the gaps in the table are larger than our measurement noise — with one exception worth naming: the 4.52x and 4.49x parallel-gain figures are close enough to each other that we would not defend the ordering. What we will defend is that they are both around 4.5x, and that four extra cores did not move that number.
What this means if you are buying
Not much, and that is the point worth making.
Core counts on a specification page have always been a weak proxy for how a machine feels. This generation makes the proxy weaker, because the counts are now split across tiers that are named differently from last year’s tiers. Eighteen cores on an M5 Pro and fourteen on an M4 Pro are not fourteen-and-four of the same thing.
If you are choosing between these machines, the numbers that answered our questions were the finish times, not the core counts. The M5 Pro was 6% to 9% faster than the M4 Pro across everything we ran. That is the honest size of the gap, and no amount of core arithmetic changes it.
What we have not tested
- Whether a Super core is faster than a Performance core on the same work. This needs a test that pins a thread to a specific core group and compares. We have not built it. Until we do, we have no performance claim about the Super tier at all.
- Power draw per tier. The old Efficiency label implied a power story. If the tier is now called Performance, the power behaviour may or may not have changed with it. We did not measure watts.
- Whether other M5 machines report the same names. We have one M5 Pro. An M5 Max or a base M5 may be labelled differently.
How to check your own machine
The fastest way is one line in Terminal:
sysctl -a | grep perflevel | grep name
That prints the name macOS assigns to each core tier on the machine you are sitting at. If you have an M5 and see something different from what we found, we would like to hear about it — corrections are the most useful mail we get.
You can also see it visually: Activity Monitor → Window → CPU History. Each tile is labelled with its tier. It is the same information, and it is the screenshot we used above.
Why we noticed
Honestly, by accident, and it is worth admitting how. We read the core configuration from sysctl early in our testing and assumed — as anyone would, because it has been true for every Apple Silicon generation until now — that perflevel0 meant performance cores and perflevel1 meant efficiency cores. We wrote down “6 performance, 12 efficiency” and moved on.
Then we photographed all three machines with Activity Monitor open, put the pictures side by side, and the labels did not match what we had written. The M5 Pro was reporting six Super cores at perflevel0 and twelve Performance cores at perflevel1 — the opposite arrangement from what we had assumed, with a tier name that does not exist on the other two machines.
We corrected our notes. We are writing it down here because the assumption we made is the one most people would make, and the specification page will not catch it for you.
Tested 14 September 2026 on a MacBook Pro 16-inch M5 Pro (48GB, macOS 26.6.2), MacBook Pro 14-inch M4 Pro (48GB, macOS 26.6.2), and MacBook Pro 14-inch M1 Pro (16GB, macOS 26.5.1).
The same three machines produced the performance numbers behind this. See the full comparison.